


Deadwood Mapping, AI Modeling & Biodiversity Monitoring


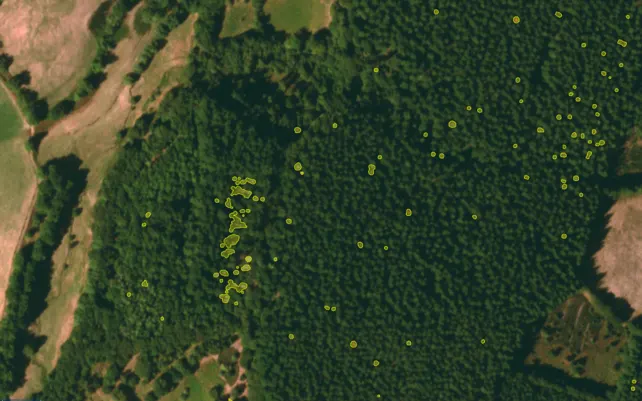
for field inspections, habitat assessments and forest management planning.
A forest owner planning a harvest and a conservation planner identifying valuable habitats both need reliable information about deadwood. Their decisions depend on where the trees are, how much is present and what condition it is in.
Remote sensing and artificial intelligence (AI) make it possible to map deadwood across extensive forest areas and direct attention to places that need a closer look. The most useful approach starts with the decision to be made, then matches the data and level of detail to that need.
Why deadwood mapping matters
Identify valuable habitats and monitor ecosystem structure.
Detect drought, storms, pests and other disturbances.
Support harvesting, route planning and safety assessments.
Contribute to certification, reporting and carbon assessments.
Deadwood includes standing dead trees and fallen trunks at different stages of decay. These structures provide habitats for a wide range of organisms, but in different ways. Standing trees offer feeding and nesting opportunities for birds and insects, while fallen logs support fungi and other organisms in contact with the forest floor. Tree species, size and decay stage influence which organisms can use the wood. Stumps can also provide important habitat as they decay and may offer insights into past disturbances and management history.
The biodiversity value of deadwood depends not only on how much is present, but also on its diversity. Tree species, size, decay stage, moisture conditions, and whether the wood is standing or lying all influence which organisms can use it. As a result, forests with similar deadwood volumes can differ substantially in ecological value.
Different tree species contribute distinct habitat qualities. Aspen deadwood is often associated with particularly high biodiversity, supporting a rich range of fungi, insects, cavity-nesting birds, lichens, and mosses. Birch, pine, and spruce deadwood also provide important ecological functions through their unique decay characteristics and habitat structures. Understanding these differences helps conservation teams identify deadwood types that are especially valuable for biodiversity.
For conservation teams and forest managers, this means that two stands with similar deadwood volumes can have different ecological values. Information on the distribution and characteristics of deadwood helps identify habitats to retain, target restoration and monitor how forest structure develops over time.
For forest owners, newly appearing groups of dead trees can highlight areas affected by drought, storms or pests, disease, or other disturbances. Mapping their extent helps prioritise inspections and assess damage alongside other forest inventory data. Repeated monitoring can support early identification of emerging forest health issues, helping reduce economic losses and allocate resources more efficiently. Establishing the cause and deciding on a response may require a field visit, as old deadwood and recent tree mortality have different implications for forest health.
For planners and harvesting contractors, location matters at the worksite. A map of fallen logs can help plan machine routes that avoid damaging retained deadwood. The precise locations of individual dead trees can also support the planning of retention tree groups, allowing planners to prioritize areas where valuable deadwood is already present. A stand-level volume estimate and the location of an individual trunk therefore answer different practical questions.
Deadwood information can also contribute to biodiversity reporting and forest certification assessments, and carbon accounting. Deadwood forms part of the forest carbon stock, although converting mapped deadwood into carbon estimates requires additional information about volume, wood density, and decay stage.
A standing deadwood inventory for Metsähallitus
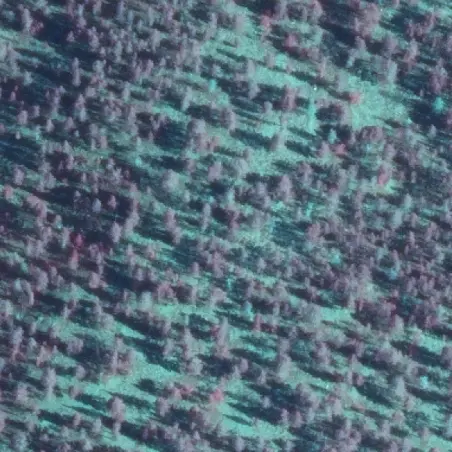
Before AI detection
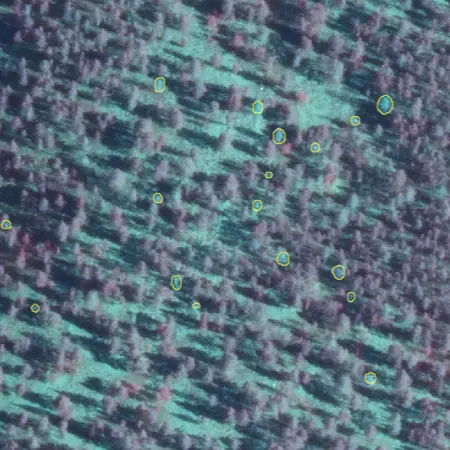
Detected deawood
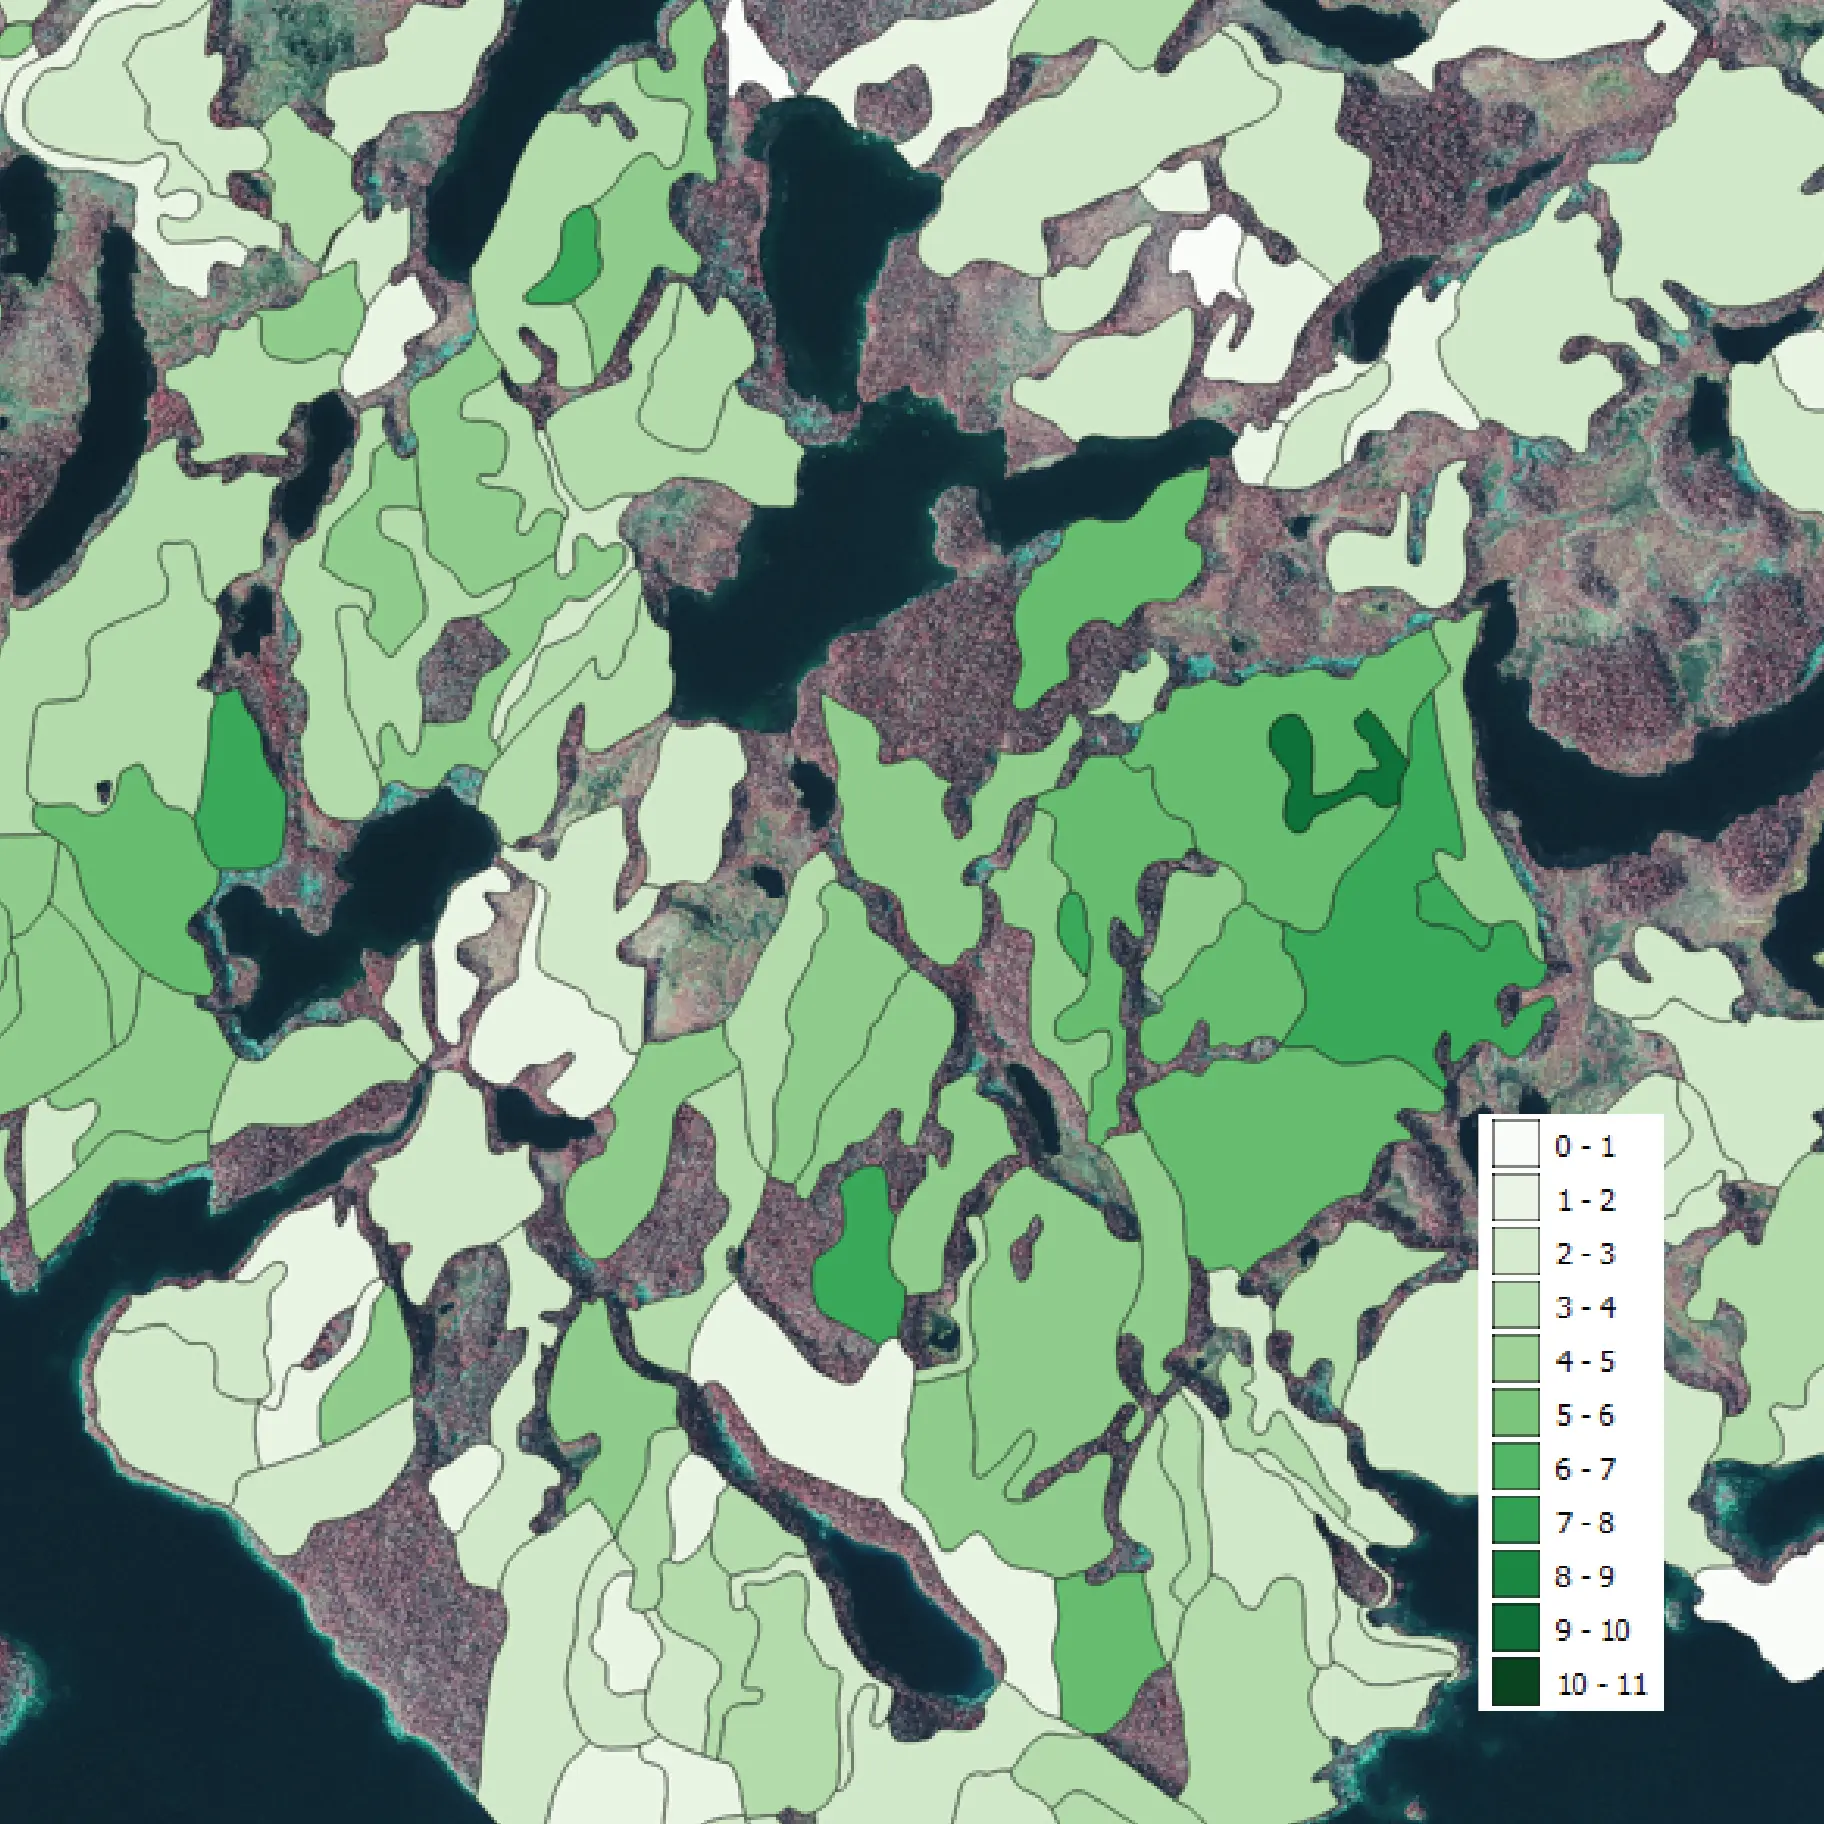
Standing deadwood volume
Arbonaut's work for Metsähallitus shows how remote sensing can make this information available at scale. Using high-resolution orthophotos from the National Land Survey of Finland, we mapped standing dead trees across 148,000 hectares of forest inventory stands. The outputs included tree locations, delineated crowns and stand-level estimates of standing deadwood volume.
These layers help connect broad biodiversity assessments with the places where further investigation is needed. The project also illustrates the scope of an image-based inventory: it mapped standing dead trees, while a complete assessment of deadwood would also need to account for fallen material. Read the Metsähallitus project reference for the full case.
How AI supports biodiversity monitoring
AI makes the interpretation of large image collections and laser scanning datasets more manageable. Models trained on labelled examples learn patterns associated with dead trees, such as crown colour and texture in images or structural features in three-dimensional data. Depending on the data source and detection method, the results can identify individual dead trees, their crowns or larger patches of affected forest. Detecting fallen deadwood is generally more challenging, particularly where logs are obscured by vegetation.
Beyond deadwood detection itself, AI can support tree counting, estimates of deadwood volume, stand-level comparisons, and monitoring changes over time. Combining these results with forest stand boundaries and other inventory information helps forest managers identify areas of interest and target field surveys or management actions. Repeated observations can also reveal newly detectable tree mortality and changes in its spatial distribution, although differences in season, image quality and detection performance must be considered.
For biodiversity monitoring, AI-based deadwood mapping provides valuable spatial information about an important forest habitat feature. Depending on the available data, the results can support the assessment of indicators such as deadwood volume, snag density, and the spatial distribution of different deadwood types. However, ecological attributes such as decay stage, tree species and small habitat structures may require field observations or more specialised data. Understanding these limitations and validating detection accuracy are essential for interpreting the results reliably.
Choosing the data for the decision
From Decision to Data
What needs to be understood?
Regional or tree-level?
LiDAR, aerial or satellite
Detect and classify
Locations and metrics
Conservation, harvesting or monitoring
The choice depends on the area, required detail, update frequency, available data and budget. Arbonaut uses LiDAR, aerial imagery and satellite data to match the analysis to the customer's needs. A regional assessment of changing forest condition calls for a different approach from locating fallen trunks within a planned harvesting site.
The appropriate data density and accuracy depend on the decision being supported. A regional screening assessment may only require enough detail to identify broad patterns of mortality, while biodiversity assessments, certification reporting, or operational planning often require information at the individual tree or deadwood feature level. Higher-resolution imagery and denser LiDAR datasets can reveal structures that coarser data cannot capture, but they also involve different acquisition costs and update cycles. Matching the data to the intended use helps ensure that the resulting inventory is both reliable and cost-effective.
Which Data Source Should You Choose?
Different deadwood mapping objectives require different data sources. This comparison provides a quick overview of the strengths and typical uses of each option.
- 🌲 LiDAR Best for: Forest structure, fallen deadwood, detailed inventories Scale: Individual tree level
- ✈️ Aerial Imagery Best for: Individual crowns, groups of dead trees Scale: Crown & group level
- 🛰️ VHR Satellite Imagery Best for: Individual crowns, groups of dead trees and continuous forest health monitoring Scale: Crown & group level
- 🌍 Sentinel-2 Best for: Change detection and large-scale monitoring Scale: Group level
LiDAR for forest structure and fallen deadwood
LiDAR uses laser pulses to measure distances and build a three-dimensional point cloud of the forest. Data collected from aircraft, drones or ground-based scanners can support deadwood detection through information on tree shape, height and structure, often combined with imagery and field reference measurements.
Very dense ALS point clouds, for example around 1,000 points per square meter, can also allow fallen trunks to be detected beneath the canopy. This is valuable when the objective includes mapping deadwood on the forest floor. Detection still depends on how well laser measurements reach the trunks, as well as their size, surrounding vegetation and survey geometry. Arbonaut's forest inventory offering includes this level of detailed mapping.
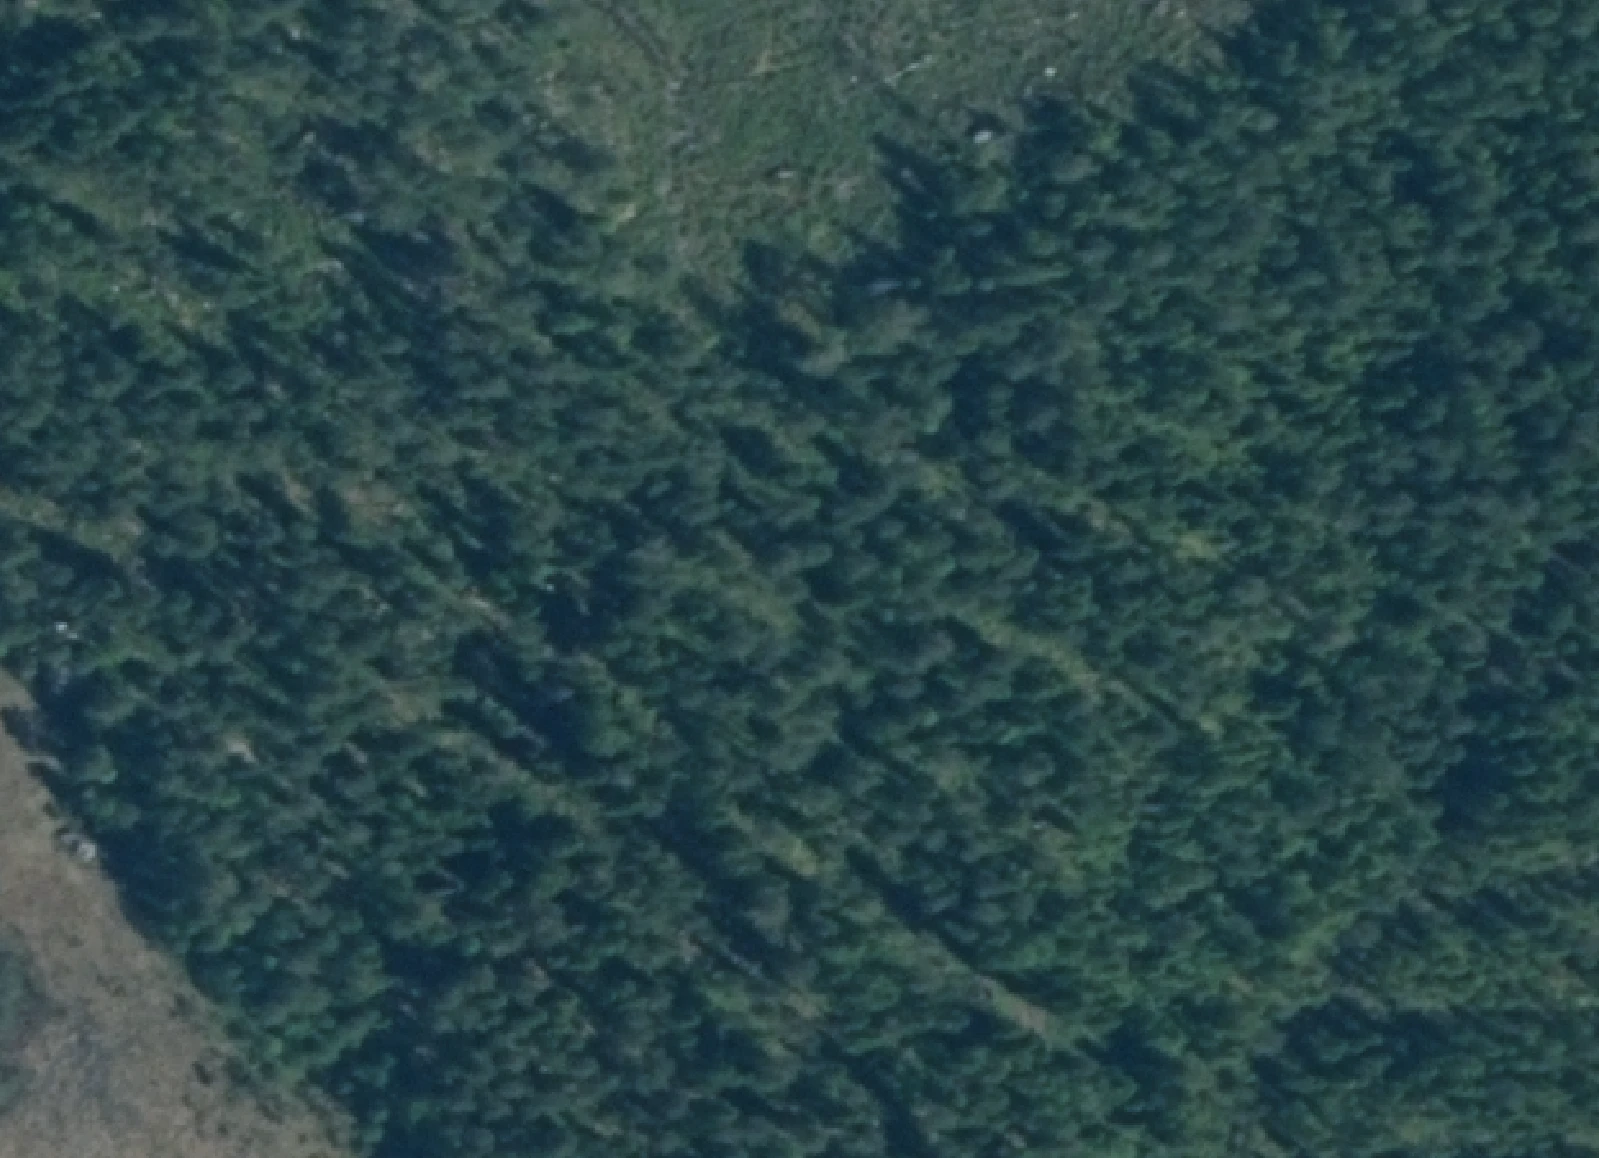
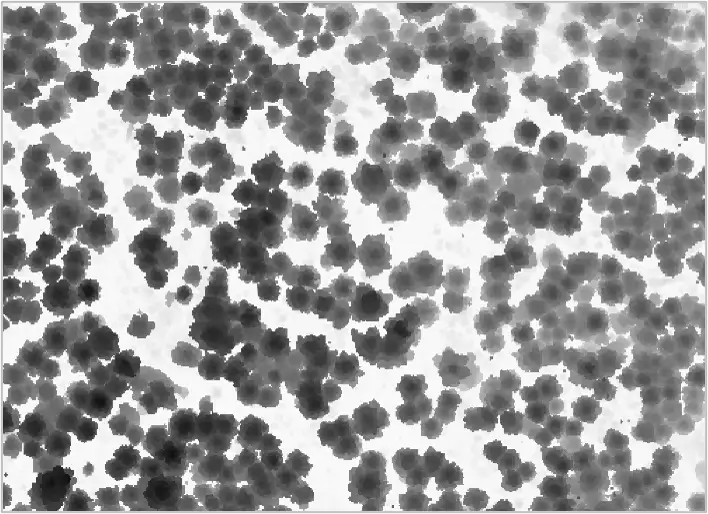
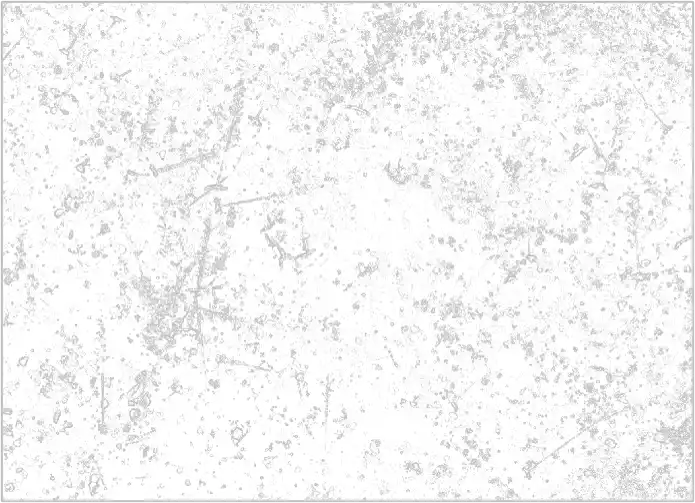
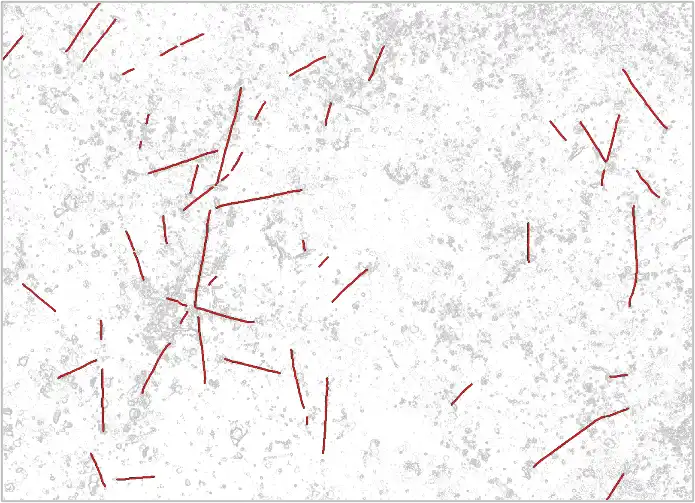
information for analysis and planning.
Existing LiDAR datasets can provide a useful starting point. Commissioning a new dense survey involves acquisition costs, and each survey describes conditions at its collection date. Frequent updates may therefore be more practical with imagery, reserving detailed laser scanning for areas where structural information is needed.
Commercial satellite imagery for individual crowns and tree groups
Very high-resolution satellite imagery provides detail below one meter, allowing suitable images to capture individual tree crowns and groups of dead trees. Commercial providers offer both archive imagery and newly tasked acquisitions so the analysis can use existing coverage or request completely new imagery.
Arbonaut has developed computer vision models for detecting standing dead trees in this imagery. Where comparable images are available, repeated mapping can help follow changes in mortality across a property or a wider region.
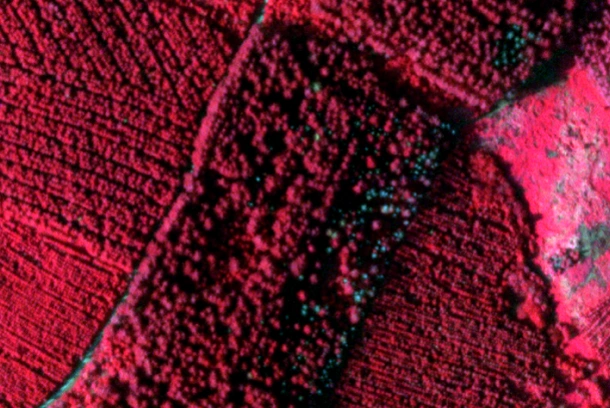
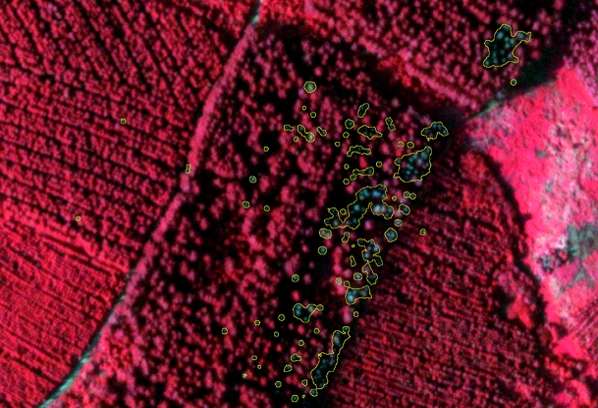
dead trees within the surrounding forest.
Image suitability is central to the result. Clouds, haze, shadows, viewing angles and seasonal differences affect interpretation. Small trees and crowns hidden beneath other trees are harder to detect. Image licensing and the availability of clear acquisitions also influence cost and timing.
Aerial imagery for detailed local and regional mapping
Aerial photographs collected from aircraft or drones provide detailed views of the canopy, typically in visible colour, sometimes with an additional near-infrared band. Orthophotos are corrected to align with map coordinates, making detected trees easy to combine with other spatial data.
Arbonaut's existing models can identify standing dead trees from suitable aerial imagery, as demonstrated by the Metsähallitus project. The image interpretation can be carried out without a new field survey, as can suitable commercial satellite analyses. Applying models in a new area still requires checking data suitability and detection performance; field reference data may be needed for validation or additional attributes.
Very fine imagery, for example below 20 cm resolution, can also support mapping exposed fallen trunks after a storm. Visibility is decisive: overhead photographs cannot show logs concealed by a closed canopy. Survey timing also matters, since post-storm mapping needs images acquired after the event. Fallen trees may still be alive, so windthrow detection and confirmed deadwood should be distinguished in the results.
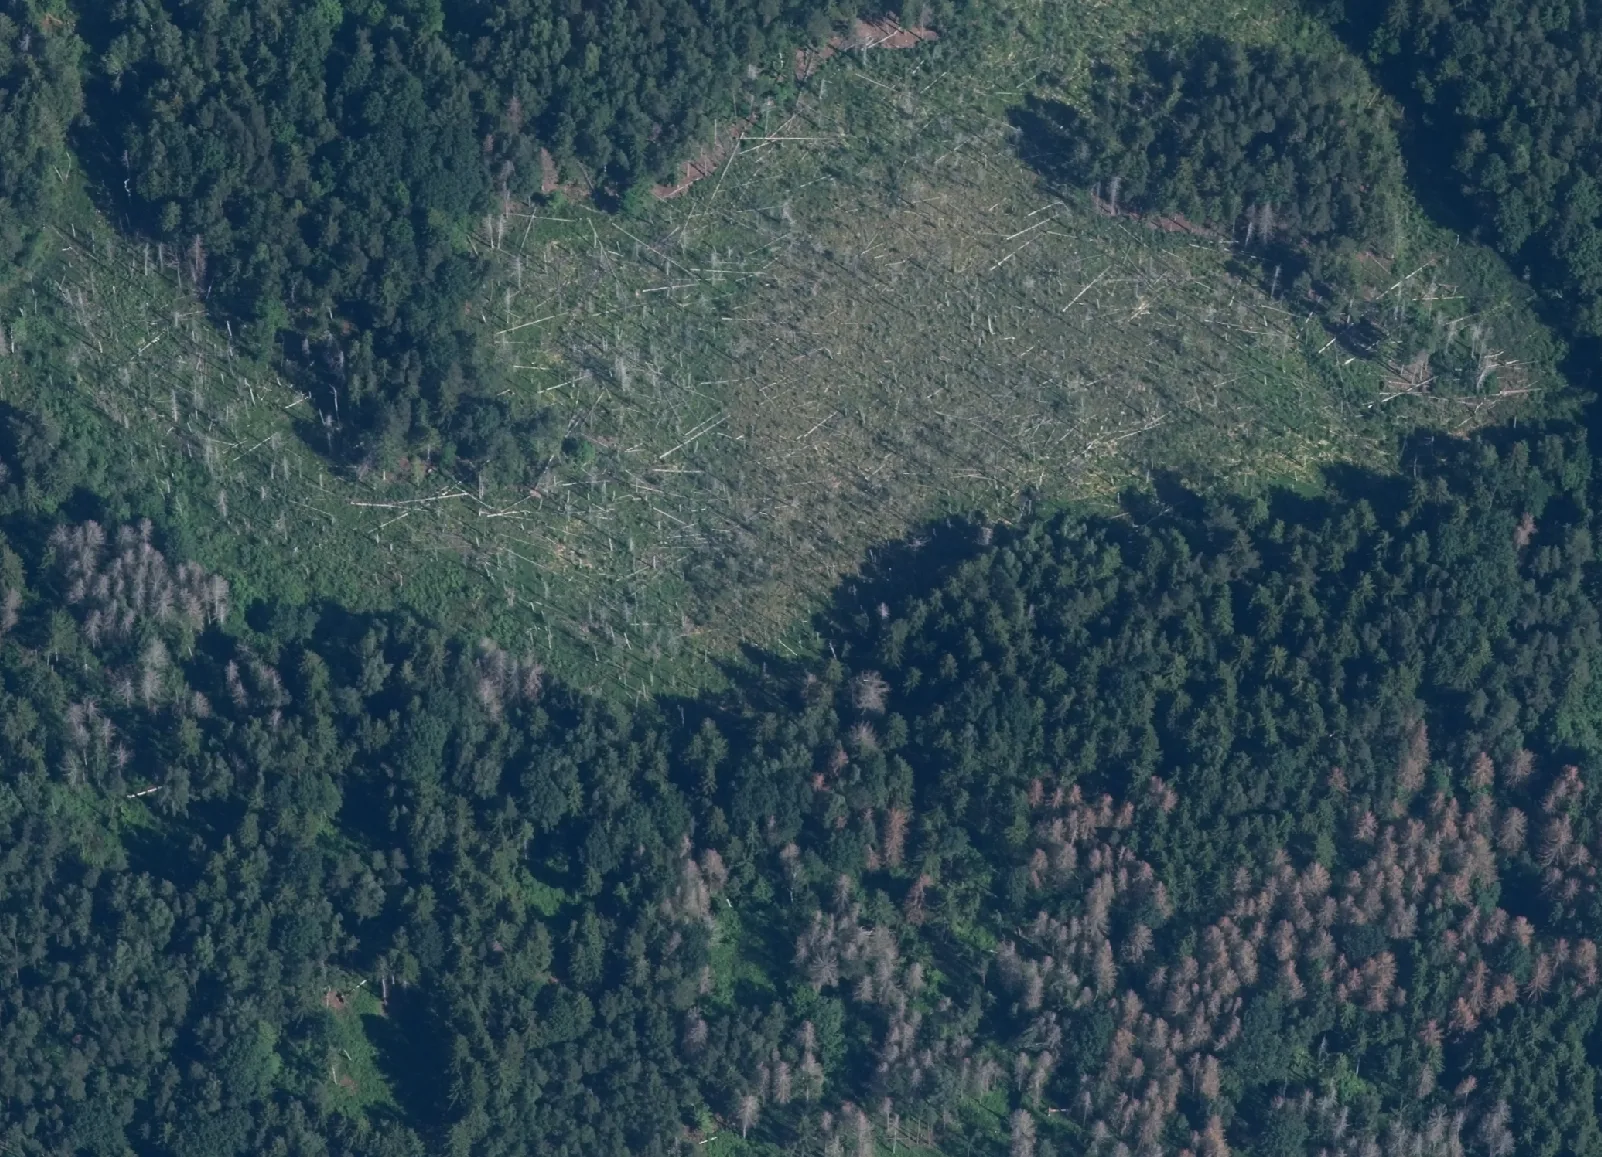
illustrates the different forms of deadwood that can be mapped where they are visible from above.
Sentinel-2 for monitoring change across large areas
Copernicus Sentinel-2 provides freely available multispectral imagery for repeated observations over large areas. Its finest bands have a spatial resolution of 10 meters; other bands have 20- or 60-meter resolution.
This makes it useful for assessing substantial patches of forest damage and tracking vegetation change over time, including changes associated with extensive bark beetle damage. It does not provide a reliable inventory of individual dead trees or fallen logs. Cloud cover and seasonal variation also need to be addressed, and a detected change alone does not establish its cause.
For a large forest estate, Sentinel-2 can help identify areas that warrant closer investigation with finer imagery or field visits. Free source data can reduce monitoring costs, while processing, interpretation and validation remain part of the service.
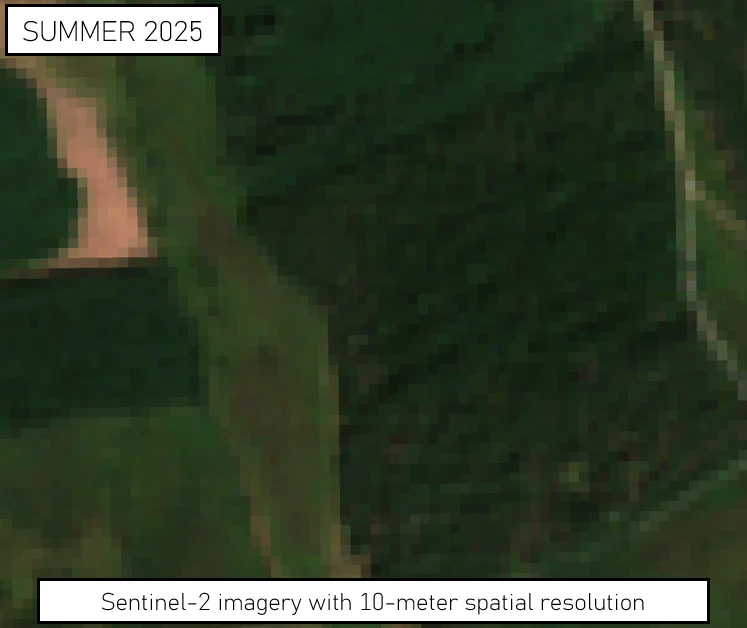
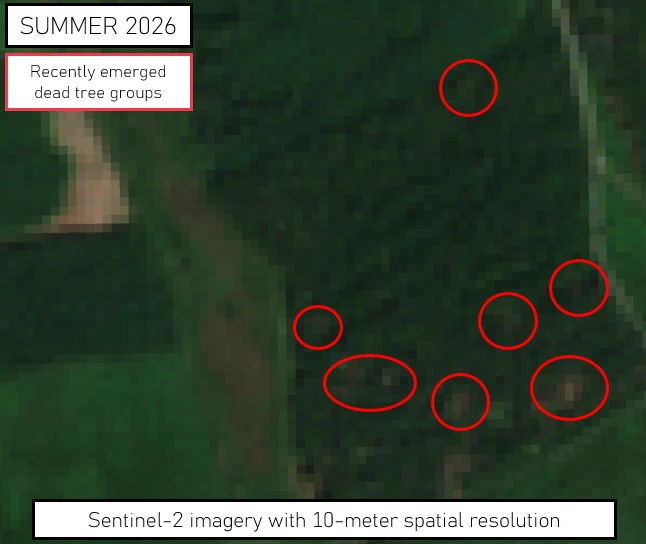
how repeated observations can help prioritise areas for closer assessment.
Why Deadwood Mapping Looks Different Around the World
While deadwood is an important component of forest ecosystems worldwide, the reasons for mapping it often differ between regions.
In many parts of Central Europe, deadwood mapping has become increasingly important for forest health monitoring and reducing economical losses. Repeated droughts, storms, and bark beetle outbreaks have created a need to identify emerging tree mortality, assess damage extent, and prioritize management responses. Here, deadwood inventories often support both biodiversity objectives and the operational management of changing forest conditions.
In the Nordic countries and other boreal forests, deadwood inventories are frequently linked to biodiversity conservation, habitat assessments, ecological restoration, and certification requirements. Understanding the amount, diversity, and distribution of deadwood helps identify habitats for species that depend on decaying wood and supports long-term monitoring of forest structure. Due to the warming summers, drought and insect risks are also increasing in the Nordics.
In plantation forests and commercially managed landscapes around the world, deadwood information may be used primarily for operational planning. Forest managers may use it to locate hazard trees, support harvesting operations, assess storm damage, optimize field inspections, or improve resource allocation across large ownership areas.
In tropical and subtropical forests, deadwood mapping is increasingly relevant for ecosystem restoration, conservation initiatives, and carbon-related assessments. As countries and organizations invest in nature-based solutions, forest monitoring programs often require information on habitat condition, ecosystem recovery, and carbon stocks alongside more traditional forest inventory metrics.
Although the underlying technologies may be similar, the most valuable outputs differ from one region to another. A biodiversity project may focus on deadwood diversity and habitat structures, while a forest health program may prioritize newly appearing mortality and change detection. Operational forestry projects may require precise tree locations and damage estimates, whereas reporting and carbon initiatives often need stand-level indicators and landscape-scale assessments.
Putting deadwood information to work
The value of deadwood mapping lies in providing forest managers with information at the scale of their decisions. This may mean identifying deadwood to retain during harvesting, planning retention tree groups, targeting stands for biodiversity surveys, or monitoring changes in tree mortality and deadwood distribution over time.
By combining AI and remote sensing with appropriate data sources and accuracy requirements, deadwood inventories can support biodiversity conservation, forest certification, carbon stock assessments, operational planning, and forest health monitoring. Ultimately, turning deadwood observations into reliable, actionable information helps forest managers make better-informed decisions and allocate resources more effectively.
Get more value from your forest data

 Cookie Policy