


LiDAR-Based Forest Inventory Methods

Forest inventory helps forest owners, managers, agencies, and planners understand what is growing, where it is growing, and how conditions are changing over time. Modern inventories increasingly combine field reference data, LiDAR, imagery, GIS layers, and modeling so decisions are based on wall-to-wall forest information rather than scattered observations alone. Arbonaut describes three partner-oriented inventory levels 1) area-based inventory, 2) tree-level inventory, and 3) hyper-resolution inventory. This allows the level of detail to match the management needs, budget, forest structure, and required LiDAR data accuracy.
In this blog, we are going to explain the 3 forest inventories applied at Arbonaut and discuss the different LiDAR point densities and their effects.
What are forest inventory methods?
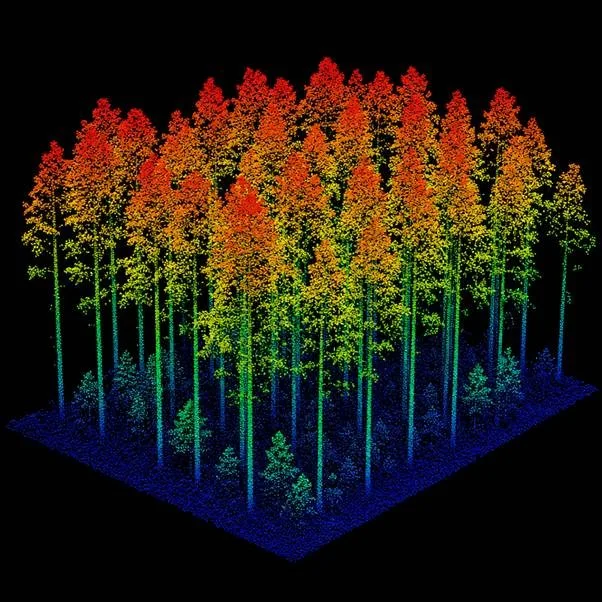
Forest inventory methods are systematic ways to measure and model forest attributes such as height, volume, diameter, species distribution, biomass, canopy density, terrain, and stand structure. In practical forest management, the goal is not simply to collect data; it is to create reliable information that supports planning, reporting, harvesting, thinning, conservation, carbon assessment, biodiversity work, and operational risk reduction.
Traditional forest inventory depends heavily on field plots and manual measurements. Those measurements remain important for calibration and validation, but remote sensing has changed what is possible at scale. LiDAR uses laser pulses to produce 3D point clouds that describe canopy height, vegetation layers, and terrain, and those point clouds can be processed (with or without field data) into forest metrics across entire landscapes.
Research and operational practice commonly distinguish between area-based approaches, which estimate attributes for plots, grid cells, or stands, and individual-tree approaches, which aim to detect and characterize trees or canopies. According to Asenova et al., LiDAR technology enables accurate assessments of forest structure, biomass estimation, and species identification, fundamentally transforming traditional inventory methods.
For partners choosing a modern LiDAR-based forest inventory, the most important question is usually not "Which method is best?" but "Which resolution is useful enough for the decision?".
A strategic planning team may need consistent stand-level estimates across millions of hectares. An operations team may need tree-level structure for thinning and harvesting. A research, biodiversity, or precision plantation project may need an ultra-detailed digital twin of trees, deadwood, and fine-scale forest structure.
The three inventory levels Arbonaut provides
Arbonaut presents forest inventory as one unified framework that can scale from broad area-based estimates to detailed tree and canopy-level data. The company describes this framework as adaptable to different forest structures, data availability, and decision-making needs, with LiDAR densities ranging from about 5 points per square meter to more than 1000 points per square meter for ultra-high detail.
Inventory Methods Explained Using Maps Analogy:
| Inventory Method | LiDAR Density | Looks Like → |
|---|---|---|
| Area-Based | 5 pts/m² | Looking at a city from an airplane |
| Tree-Level | 20 pts/m² | Looking from a helicopter |
| Hyper-resolution | 1000 pts/m² | Walking through the streets |
That tiered structure matters because inventory detail has costs and trade-offs. Higher point cloud density can support finer point cloud analysis, more detailed LiDAR point classification, and more precise structural interpretation, but it also increases data volume, processing requirements, acquisition planning, and quality-control needs. Lower-density LiDAR can still be highly effective when the objective is area-based inventory across large landscapes, especially when field reference data and statistical modeling are well designed.
Area-based inventory
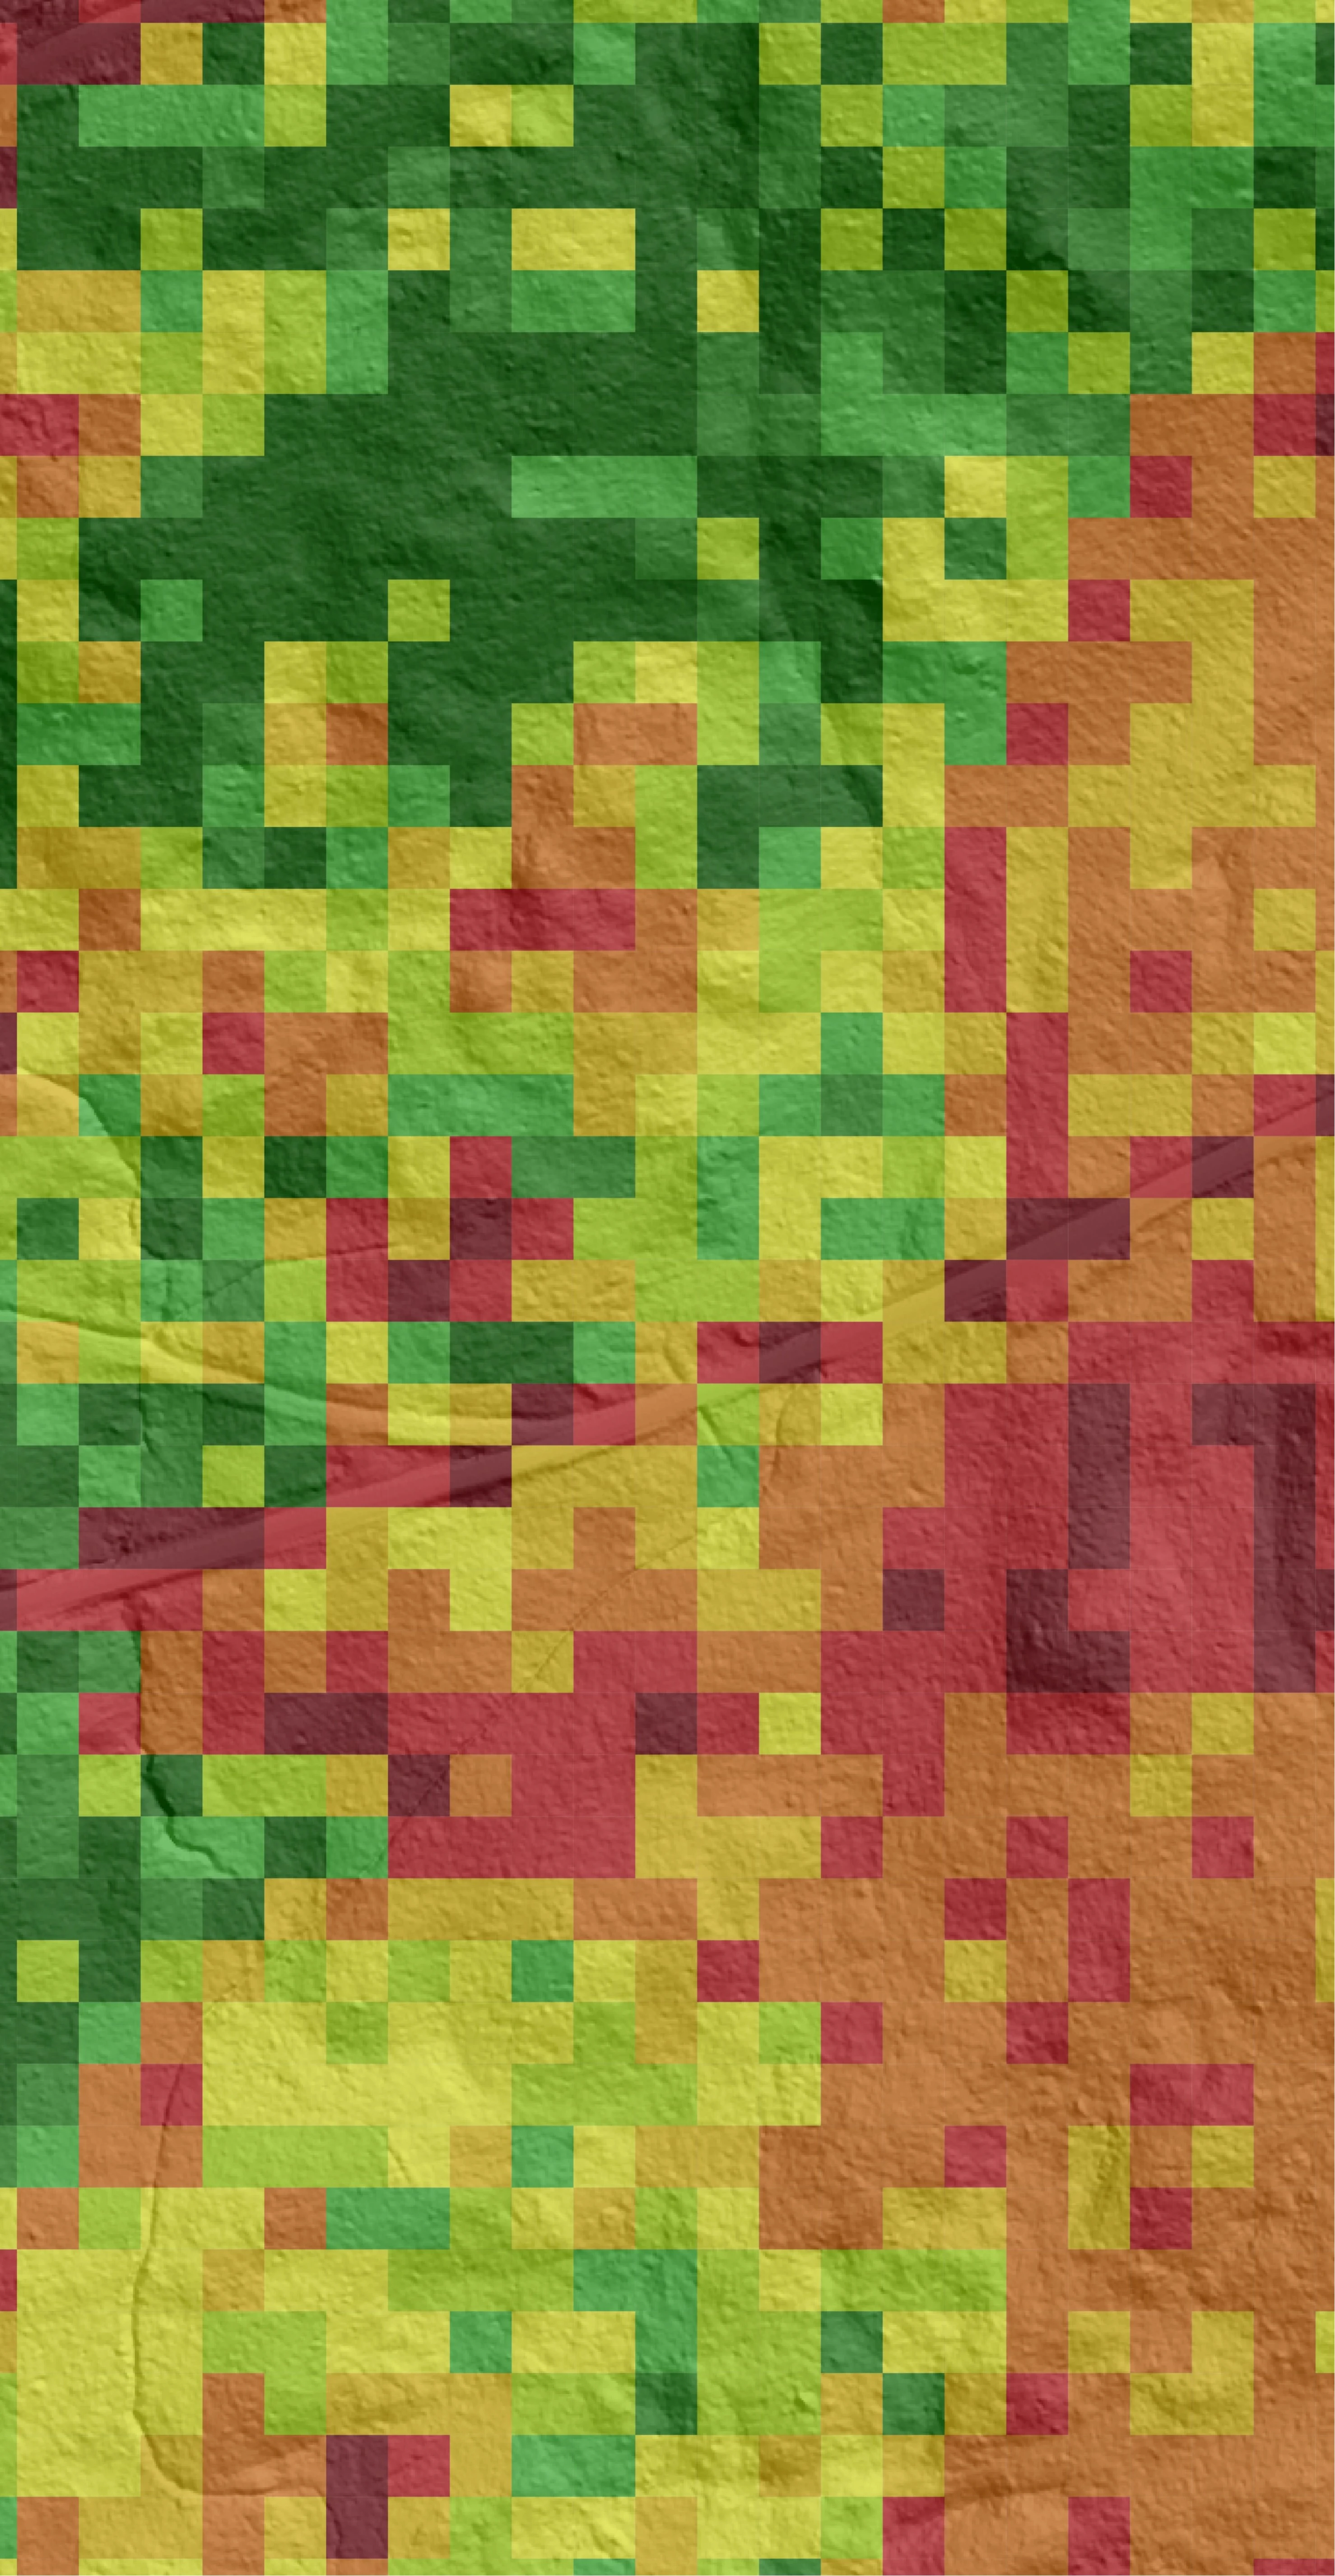
Area-based inventory is the broadest and most scalable of the three methods. Arbonaut describes its area-based forest inventory as a cost-efficient and consistent way to produce forest data at stand and grid level for strategic planning, reporting, and large-area assessment.
Outputs include:
- Volume estimates
- Tree height estimates
- Diameter estimates
- Species distribution
- Canopy density
- Terrain models
In an area-based approach, LiDAR data is not expected to identify every individual tree. Instead, the point cloud is summarized into metrics for a defined area such as a sample plot, grid cell, or stand. Those metrics may describe height percentiles, canopy cover, vertical distribution, vegetation density, and terrain. At this level already, it delivers sufficient stand-level and microstand-level data to guide thinning scheduling and management decisions. Field plot measurements are then used to build models that relate LiDAR-derived metrics to forest attributes, and those models are applied across the full inventory area. This is why area-based inventory is often the practical choice when managers need consistent information over very large holdings.
The main strength of area-based inventory is balance. It can cover forests and plantations at scale, support reporting and strategic planning, and provide comparable outputs for many stands without requiring ultra-high-density LiDAR everywhere. It is especially useful when decisions are made at the stand, compartment, estate, or regional level rather than at the level of individual trees.
Tree-level inventory
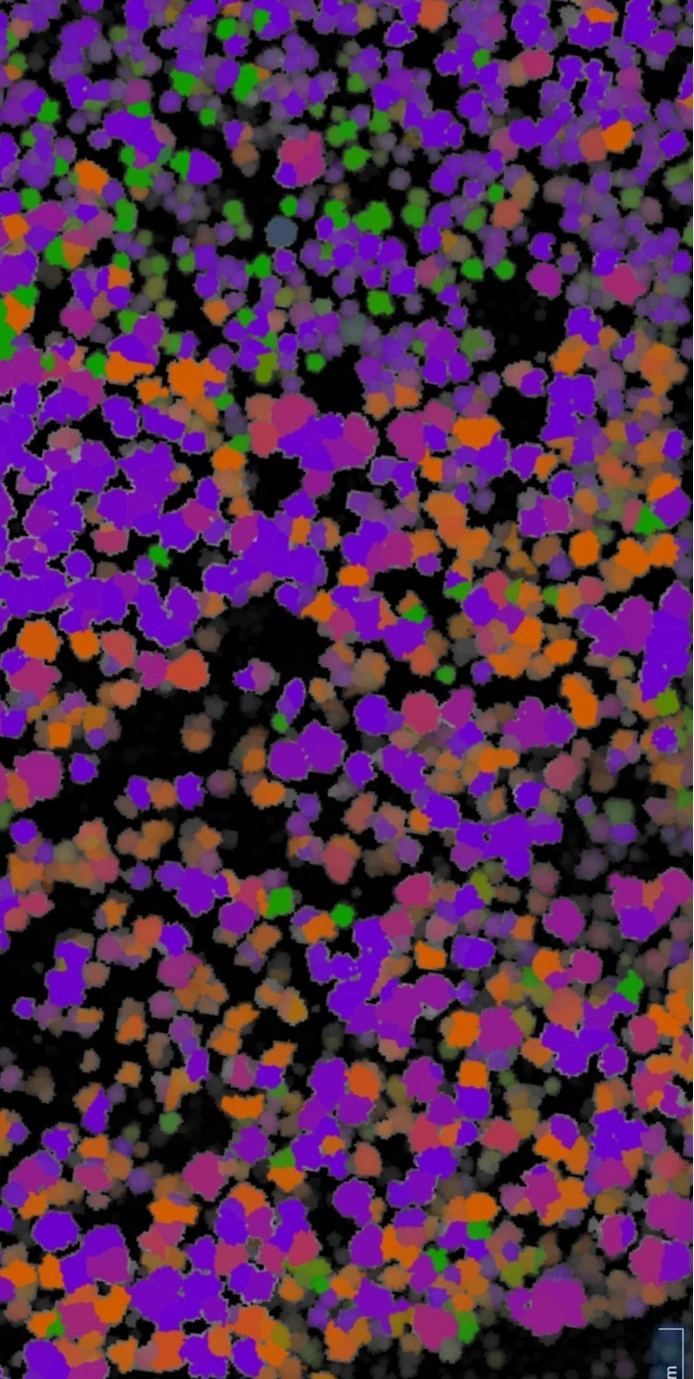
Tree-level inventory moves from stand or grid estimates toward per-tree information. Arbonaut describes its tree-level forest inventory as per-tree forest data for operational decision-making, including thinning, harvesting, and other forest management activities.
Outputs include:
- Individual tree detection
- Per-tree height measurements
- Per-tree diameter estimates
- Crown and canopy dimensions
- Tree species classification
- Tree-level volume & biomass modeling
- Tree-level datasets
- Grid-level datasets
- Stand-level datasets
- Spatially referenced forest inventory data for analysis and planning
- Standing deadwood detection
- Terrain conditions
Arbonaut notes this level uses 20+ points per square meter and is particularly effective in even-aged, intensively managed forests such as plantations.
The practical advantage is sharper operational insight. Instead of only knowing that a stand has a certain average height or volume, managers can better understand how trees are distributed, which areas are crowded, where thinning may be needed, and how canopy structure varies within a stand. This can support harvest planning, product assortment evaluation, growth forecasting, route planning, and verification of field observations.
Tree-level inventory still requires careful interpretation. Individual tree detection is easier in even-aged plantations with clear canopy separation than in dense, mixed, multilayered natural forests. It also depends on LiDAR point density, scan geometry, season, canopy closure, terrain, and the algorithms used for segmentation and classification. High-density data improves the amount of structural information available, but it does not remove the need for reference data, validation, and sound forest modeling.
Hyper-resolution inventory
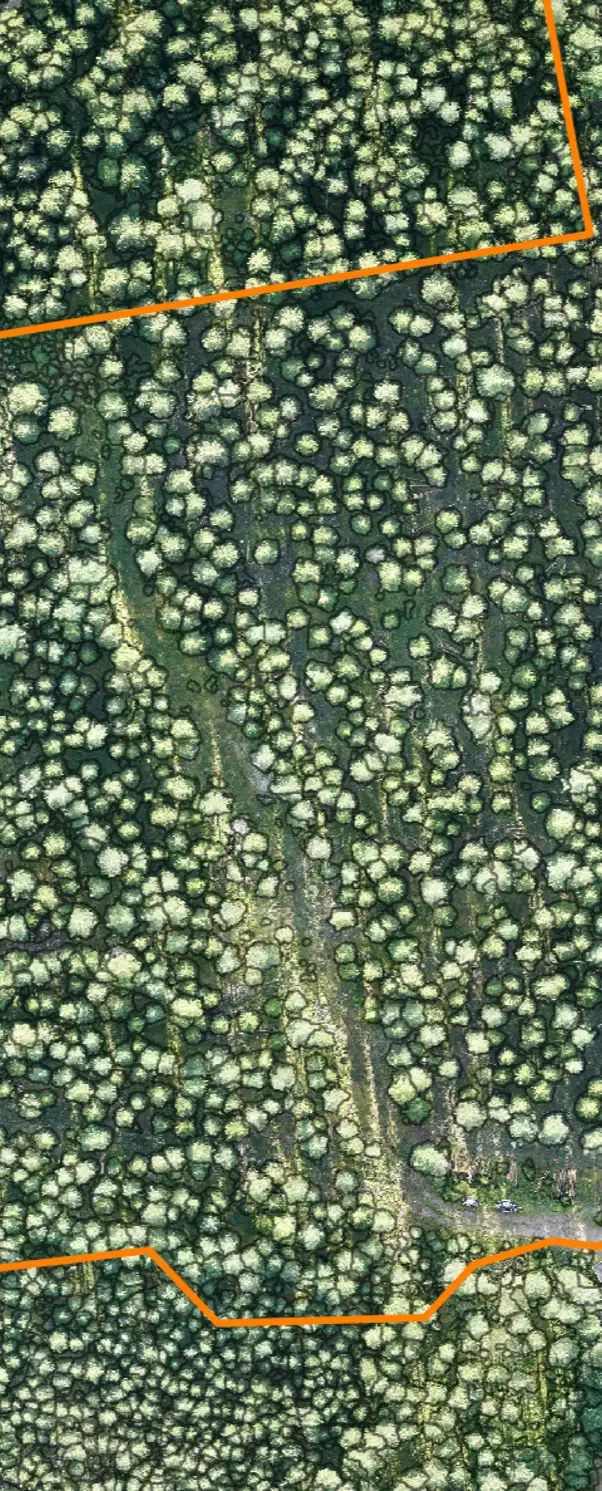
Hyper-resolution inventory is the highest-detail level. Arbonaut describes it as near-complete detection and characterization of individual trees and canopies using remote sensing data. Its hyper-resolution inventory is positioned as a true digital twin of the forest using 1000+ points per square meter.
Outputs include:
- Canopy size measurements
- Canopy structure analysis
- Species-related characterization
- Tree species classification (>90% accuracy)
- Standing & lying deadwood detection
- Fallen deadwood detection
- Forest pre-planning
- Scientific research applications
- Nature value and biodiversity assessment
- Detailed plantation planning
- Harvest planning
- Terrain conditions
The defining feature is not simply "more LiDAR". It is a different level of forest representation. At hyper-resolution, the point cloud may contain enough detail to support fine-scale canopy analysis, more advanced object detection, detailed deadwood mapping, structural habitat indicators, and richer visualization for decision-makers. At this level, you gain detailed and reliable information rather than just indicators, including accurate detection of both standing and lying deadwood. Broadleaved species can also be distinguished, enabling the identification of high biodiversity-value trees such as aspen. This can be valuable where the question depends on individual canopies, microstructure, tree condition, or biodiversity-related features that are invisible or generalized in stand-level outputs.
For one of our partners, the objective was to establish an accurate baseline for their forests, enabling them to assess how each forest management operation is likely to affect biodiversity over the coming years. Another partner sought to maximize the value of ultra-high-density LiDAR to move toward fully automated forest inventories by capturing detailed information on lying deadwood, enhanced species identification, timber flow optimization, and detailed terrain characterization.
The trade-off is that hyper-resolution inventory demands more from the entire workflow. Data acquisition must be planned for very high point cloud density. LiDAR data processing must handle larger files, more complex LiDAR point classification, and more intensive quality control. The method is best justified when the extra detail changes the decision, such as in high-value plantations, biodiversity assessment, research, pre-harvest planning, or selected priority areas.
The practical differences among the three methods
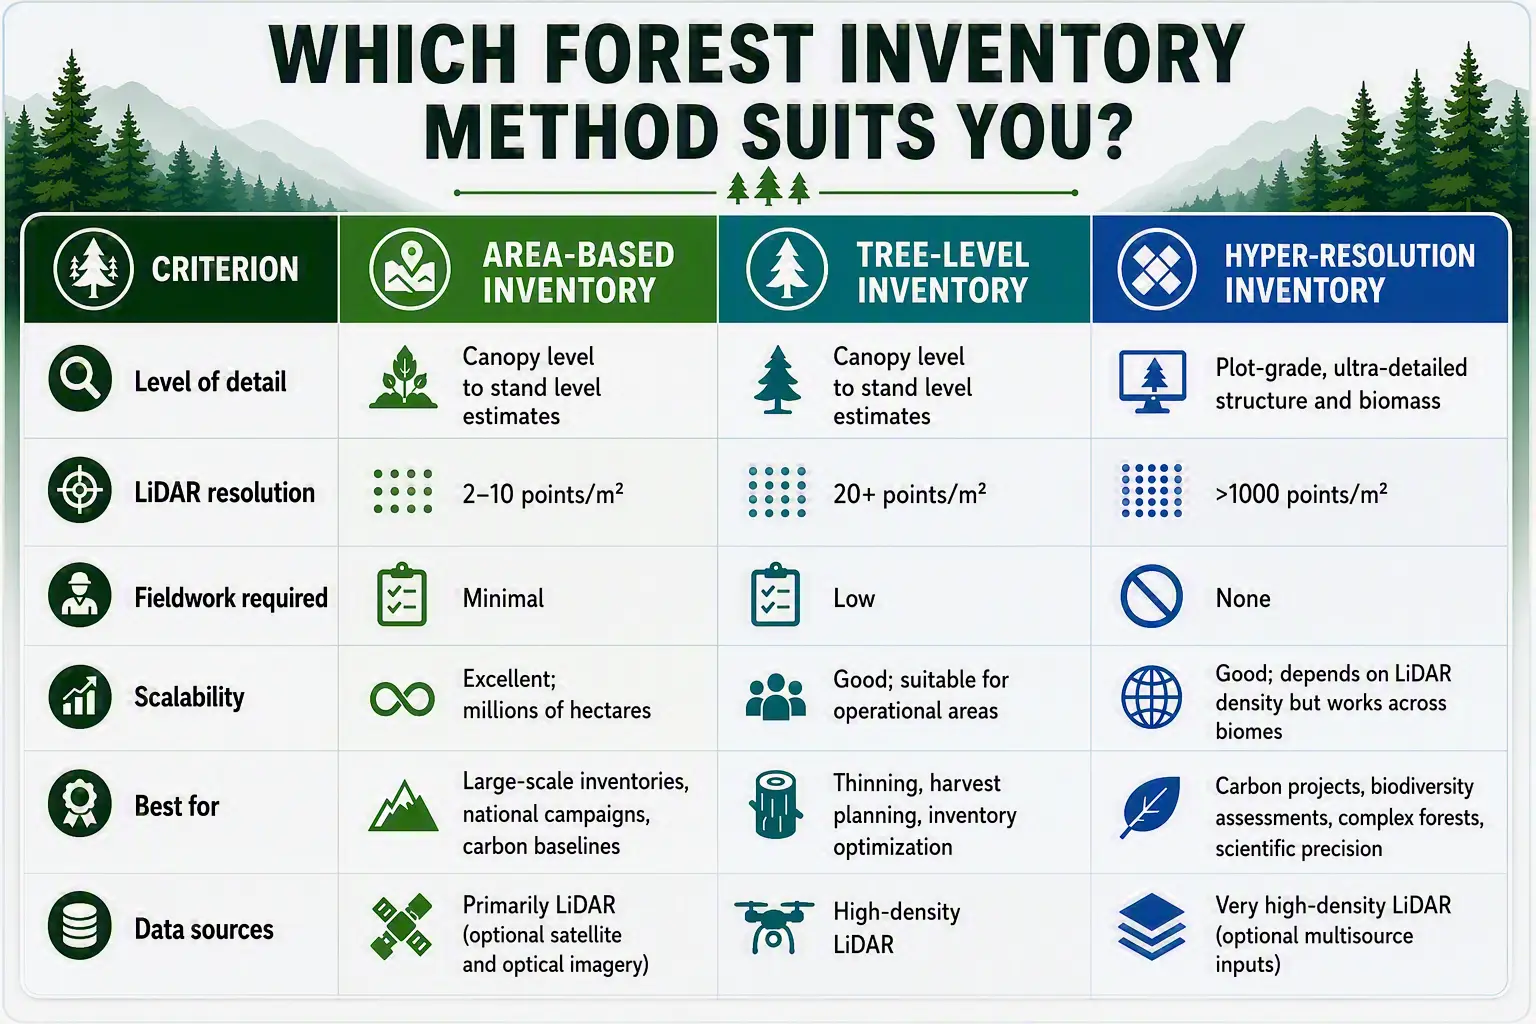
The three methods differ mainly by decision scale, data density, output resolution, and analytical ambition. Area-based inventory answers questions about stands, grids, compartments, estates, and regions. Tree-level inventory answers questions about individual trees and canopies while still producing stand and grid summaries. Hyper-resolution inventory aims to create a much more complete digital representation of forest structure, including canopy details and features such as standing or fallen deadwood.
A simple way to think about the differences is:
- Area-based inventory is best when the question is, "What are the forest attributes across this area?" It emphasizes consistency, coverage, and cost-efficiency.
- Tree-level inventory is best when the question is, "How are individual trees and canopies distributed, and how should operations respond?" It emphasizes per-tree estimates and operational decisions.
- Hyper-resolution inventory is best when the question is, "What is the detailed 3D structure of this forest, down to canopies, deadwood, and fine-scale features?" It emphasizes very high detail and specialized analysis.
These methods can also be layered over time. Arbonaut notes that customers can begin with area-based insights and later add tree-level or hyper-resolution detail for selected areas while maintaining data continuity. That staged approach can be useful when a forest organization needs a reliable baseline first and then wants deeper analysis for plantations, harvest blocks, biodiversity hotspots, or high-value stands.
How does LiDAR point density affect forest inventory accuracy?
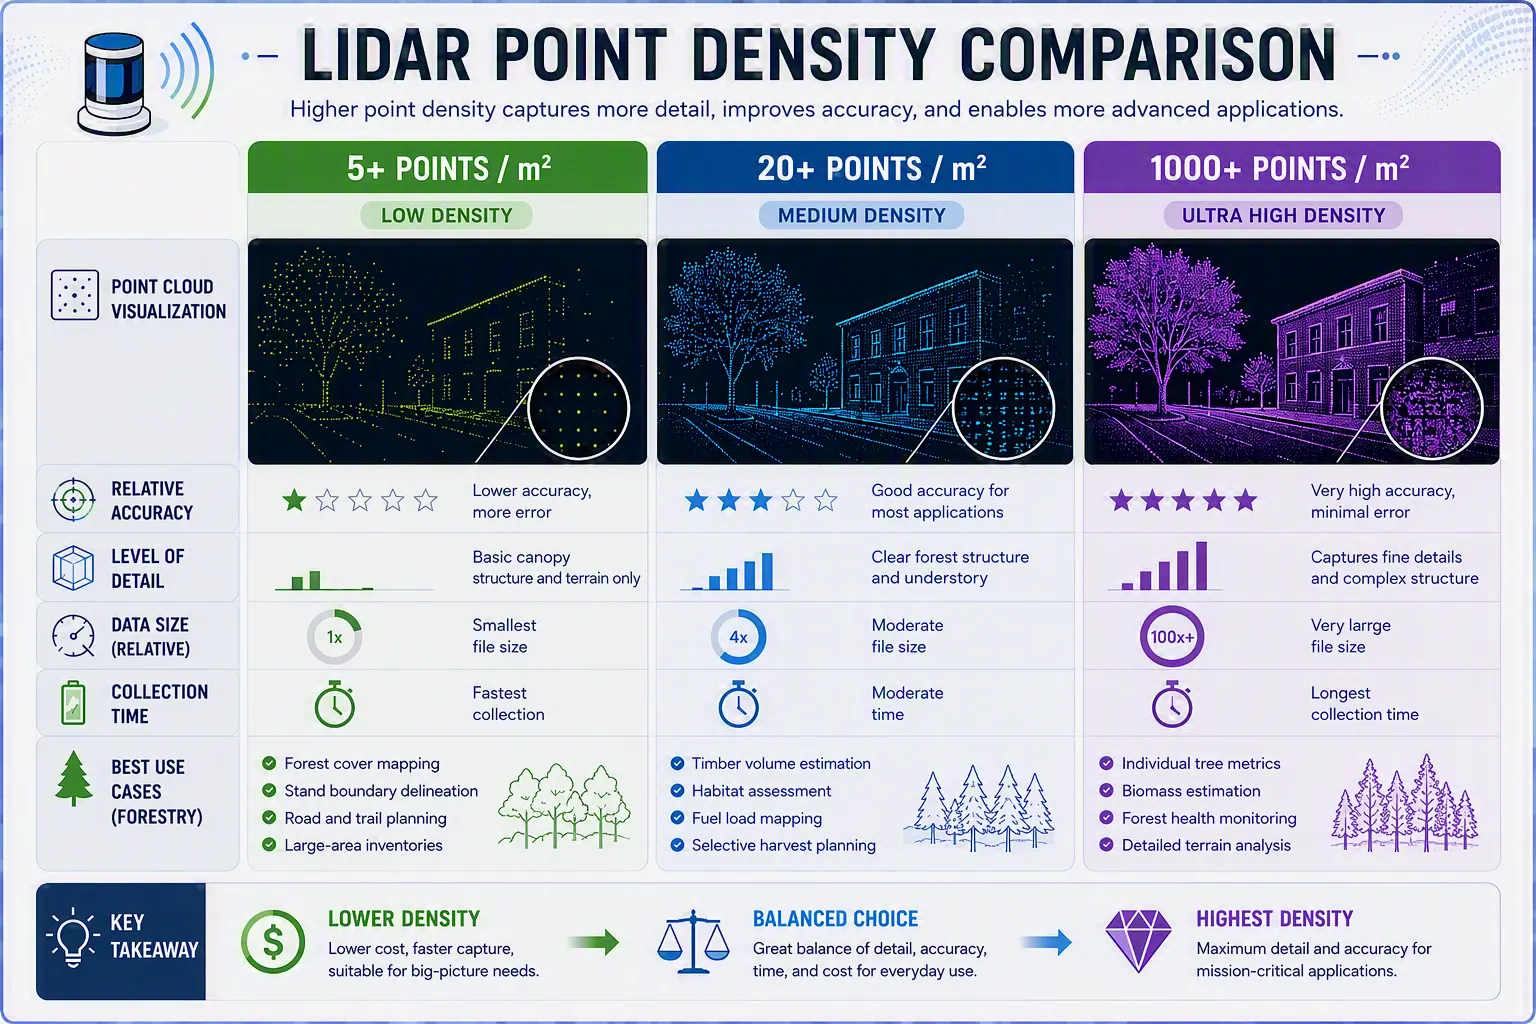
LiDAR point density affects how much 3D information is available for modeling, classification, segmentation, and validation. Area-based inventory can often perform well with moderate or even relatively low point densities because the method summarizes many points into plot, grid, or stand metrics. Tree-level and hyper-resolution inventory usually benefit more from higher density because they depend on detecting canopies, separating trees, estimating individual dimensions, and representing fine-scale structure.
Point density is commonly expressed as points per square meter. Chasmer et al. emphasize that optimizing LiDAR point cloud density is crucial for accurate inventory assessments, illustrating that lower density may miss essential structural information in heterogeneous forests.
Low to moderate density supports area-based inventory
Area-Based Inventory (~5 pts/m²)
- Estimate timber volume
- Estimate average tree height
- Forest management planning
- Detect every tree
- Identify deadwood
Area-based inventory is generally the least demanding of the three Arbonaut inventory levels from a point density perspective. Arbonaut positions area-based inventory within a framework that can use LiDAR densities beginning around 5 points per square meter, and the method focuses on stand and grid-level attributes rather than complete individual-tree reconstruction.
This works because area-based inventory relies on statistical relationships between field measurements and LiDAR metrics. Height percentiles, canopy density metrics, and terrain-normalized vegetation metrics can be robust even when the point cloud is not dense enough to separate every canopy. Studies of airborne laser scanning have long shown that area-based approaches are widely used for forest inventory attributes such as basal area, stem volume, mean diameter, and mean height, with models applied at grid level over the area of interest.
The limitation is that lower-density data cannot answer questions it was not designed to answer. It may estimate stand volume well enough for planning, but it may not reliably count suppressed trees, describe canopy shape, detect small deadwood, or separate overlapping canopies. If the business decision depends on individual tree condition or precise spatial arrangement, a higher-resolution method is usually more appropriate.
Medium density improves tree-level detection, but forest structure still matters
Tree-Level Inventory (20+ pts/m²)
- Count individual trees
- Measure canopy size
- Detect dominant/suppressed trees
- Detailed branch structure
- Near-complete understory capture
Tree-level inventory typically needs higher density because it relies on identifying individual canopies and deriving per-tree attributes. Arbonaut specifies 20+ points per square meter for tree-level inventory and highlights its effectiveness in even-aged, intensively managed forests such as plantations.
The reason is straightforward: individual tree detection needs enough points to define tree tops, canopy boundaries, canopy dimensions, and vertical structure. Higher point cloud density can make tree segmentation more stable, especially when combined with suitable scan geometry, high-quality terrain normalization, and image or spectral data for species interpretation.
Tree-level accuracy depends on more than density. Even-aged pine or eucalyptus plantations with regular spacing are far easier to segment than mixed, uneven-aged, broadleaf forests with overlapping canopies and understory layers. Leaf-on versus leaf-off acquisition, scan angle, platform height, wind, and understory complexity can all affect the final result. In practice, point cloud density improves the odds of reliable per-tree information, but validation remains essential.
Ultra-high density enables hyper-resolution inventory
Hyper-Resolution Inventory (1000+ pts/m²)
- Detailed canopy architecture
- Deadwood mapping
- Habitat analysis
- Research-grade visualization
- Near-complete tree detection
Hyper-resolution inventory uses very dense LiDAR to represent the forest as a detailed 3D environment. Arbonaut's hyper-resolution level is described with 1000+ points per square meter and is intended for near-complete detection and characterization of individual trees and canopies.
At this density, point cloud analysis can move beyond standard tree detection toward detailed canopy architecture, deadwood mapping, structural complexity, and research-grade visualization. The value is strongest when small structural differences matter. For example, biodiversity assessments may require information about deadwood and habitat structure, while detailed plantation planning may benefit from highly localized information about canopy development, tree competition, and harvest readiness.
Research conducted by Xiang et al. reveals that high-density airborne LiDAR shows promise for detailed forest inventory, successfully detecting many understory trees across different forest types. Also, that when the point density drops below around 100 points per square meter, the segmentation quality declines significantly in forests with complex structures. Therefore, highlighting the need for the higher point densities in LiDAR data collection in forest management.
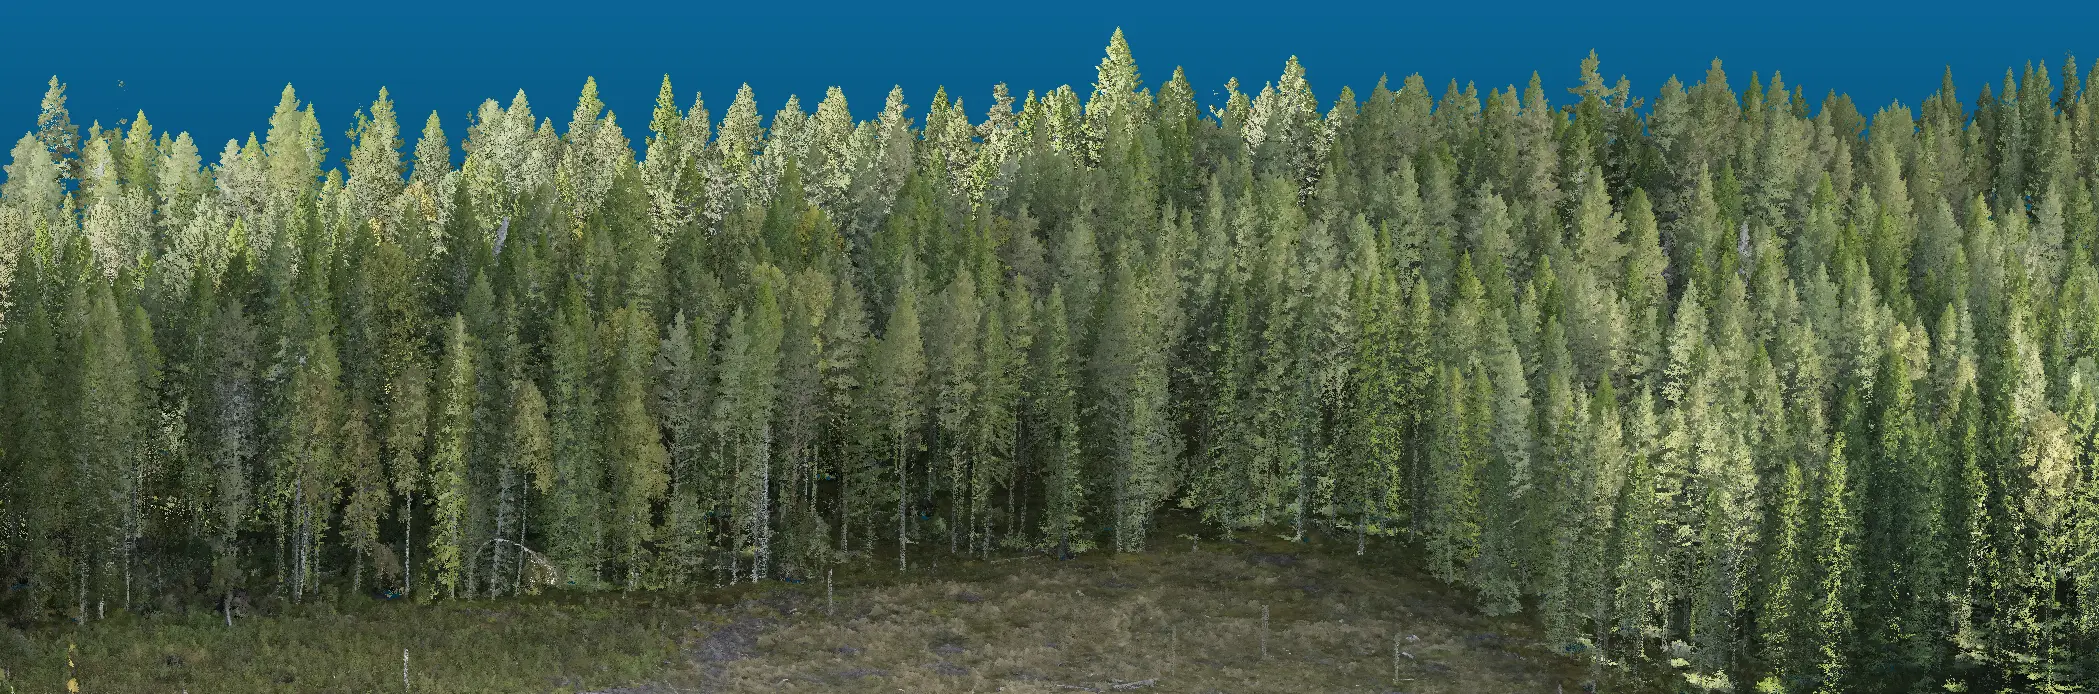
Results & Impact of Forest Inventory
Common results include:
- Forest structure metrics, such as canopy height, mean height, height percentiles, canopy dimensions, canopy density, and vertical complexity.
- Timber and biomass estimates, such as volume, basal area, diameter estimates, biomass, growth potential, and product assortment indicators.
- Tree density and stocking indicators, such as stems per hectare, stand density, thinning index, crowding, or canopy closure.
- Species and composition layers, often supported by imagery, spectral data, field plots, or local models.
- Terrain products, including digital terrain models, slope, wetness, trafficability, water flow, and road or access analysis.
- Operational planning layers, such as harvest readiness, thinning priority, route planning, vehicle mobility, and stand boundaries.
- Biodiversity and risk indicators, including deadwood, structural diversity, fire fuel loads, habitat features, and damage detection where suitable data is available.
This is where LiDAR data accuracy becomes very useful. Wulder et al. present several case studies demonstrating the practical application of LiDAR in forest monitoring, illustrating its value in both operational management and scientific research. An inventory output does not need to be perfect in an abstract sense; it needs to be accurate, current, and well documented enough for the intended decision.
Take a look at other projects where different forest inventory methods were used with LiDAR technology -> Customer Cases
When a hybrid approach makes sense
Many forest organizations do not need a single method everywhere. A hybrid strategy can provide broad coverage and targeted detail.
For example, an owner might use area-based inventory for an entire estate, tree-level inventory for operational plantation blocks, and hyper-resolution inventory for high-value research areas, biodiversity zones, or pre-harvest planning. This approach keeps costs aligned with value. It also allows teams to build a consistent baseline before investing in ultra-detailed point cloud analysis where it matters most.
Arbonaut's unified framework supports this kind of scaling because the inventory can begin with area-based insights and add tree-level or hyper-resolution detail later for selected areas. That is often a practical path for partners that want better forest intelligence but do not yet know which areas require the most detail.
Key takeaways
Common results include:
- Forest inventory methods should be selected by the needed information.
- Area-based inventory provides consistent stand and grid-level information for strategic planning, reporting, and large-area assessment.
- Tree-level inventory provides per-tree and canopy-level information for operational forest management, especially in even-aged and intensively managed forests.
- Hyper-resolution inventory uses ultra-high-density LiDAR to create a detailed digital twin for canopy analysis, deadwood detection, biodiversity assessment, research, and detailed planning.
- Point cloud density matters most when the method depends on individual tree detection or fine-scale structure.
- A staged or hybrid approach can deliver broad coverage first and deeper detail where it produces clear management value.
Modern forest inventory is moving from isolated measurements toward continuous, spatially complete forest intelligence. Area-based inventory, tree-level inventory, and hyper-resolution inventory are not competing ideas; they are different levels of resolution for different management questions. The right method gives forest managers enough detail to act confidently while keeping acquisition, processing, and validation aligned with the real decisions on the ground.

Not sure which method fits your needs?
Compare inventory options with a forestry expert and receive tailored recommendations.

 Cookie Policy